Widget
Overview
Widgets are blocks that can be arranged inside the Valeiot dashboards, enabling visual customization. They display data from Data Sources as interactive charts, gauges, maps and more.
- Drag-and-Drop: Intuitive interface for customization and arranging
- Customizable: Adjust colors, scales, and display formats
- Flexible: Display Data Points, Users lists, Device lists, Entities lists, Objects and much more.
- Real-Time Data Visualization: Websocket support for real-time updates.
Widget Library
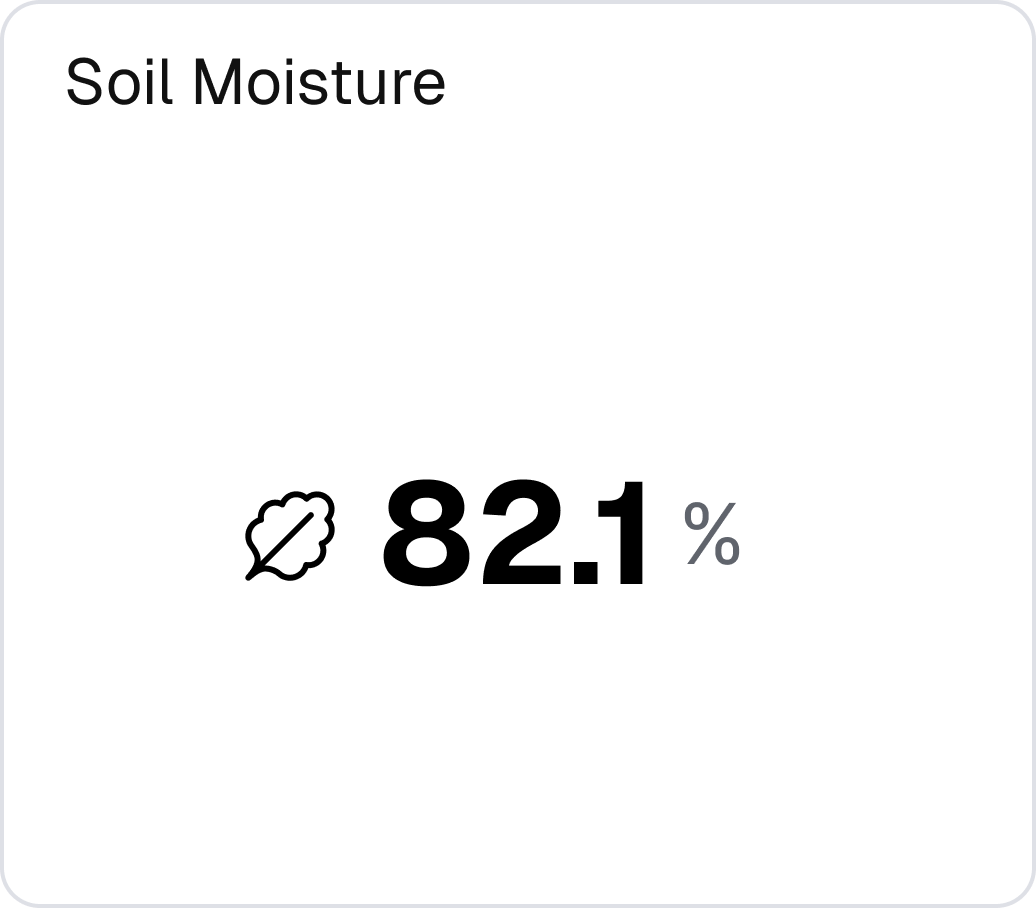
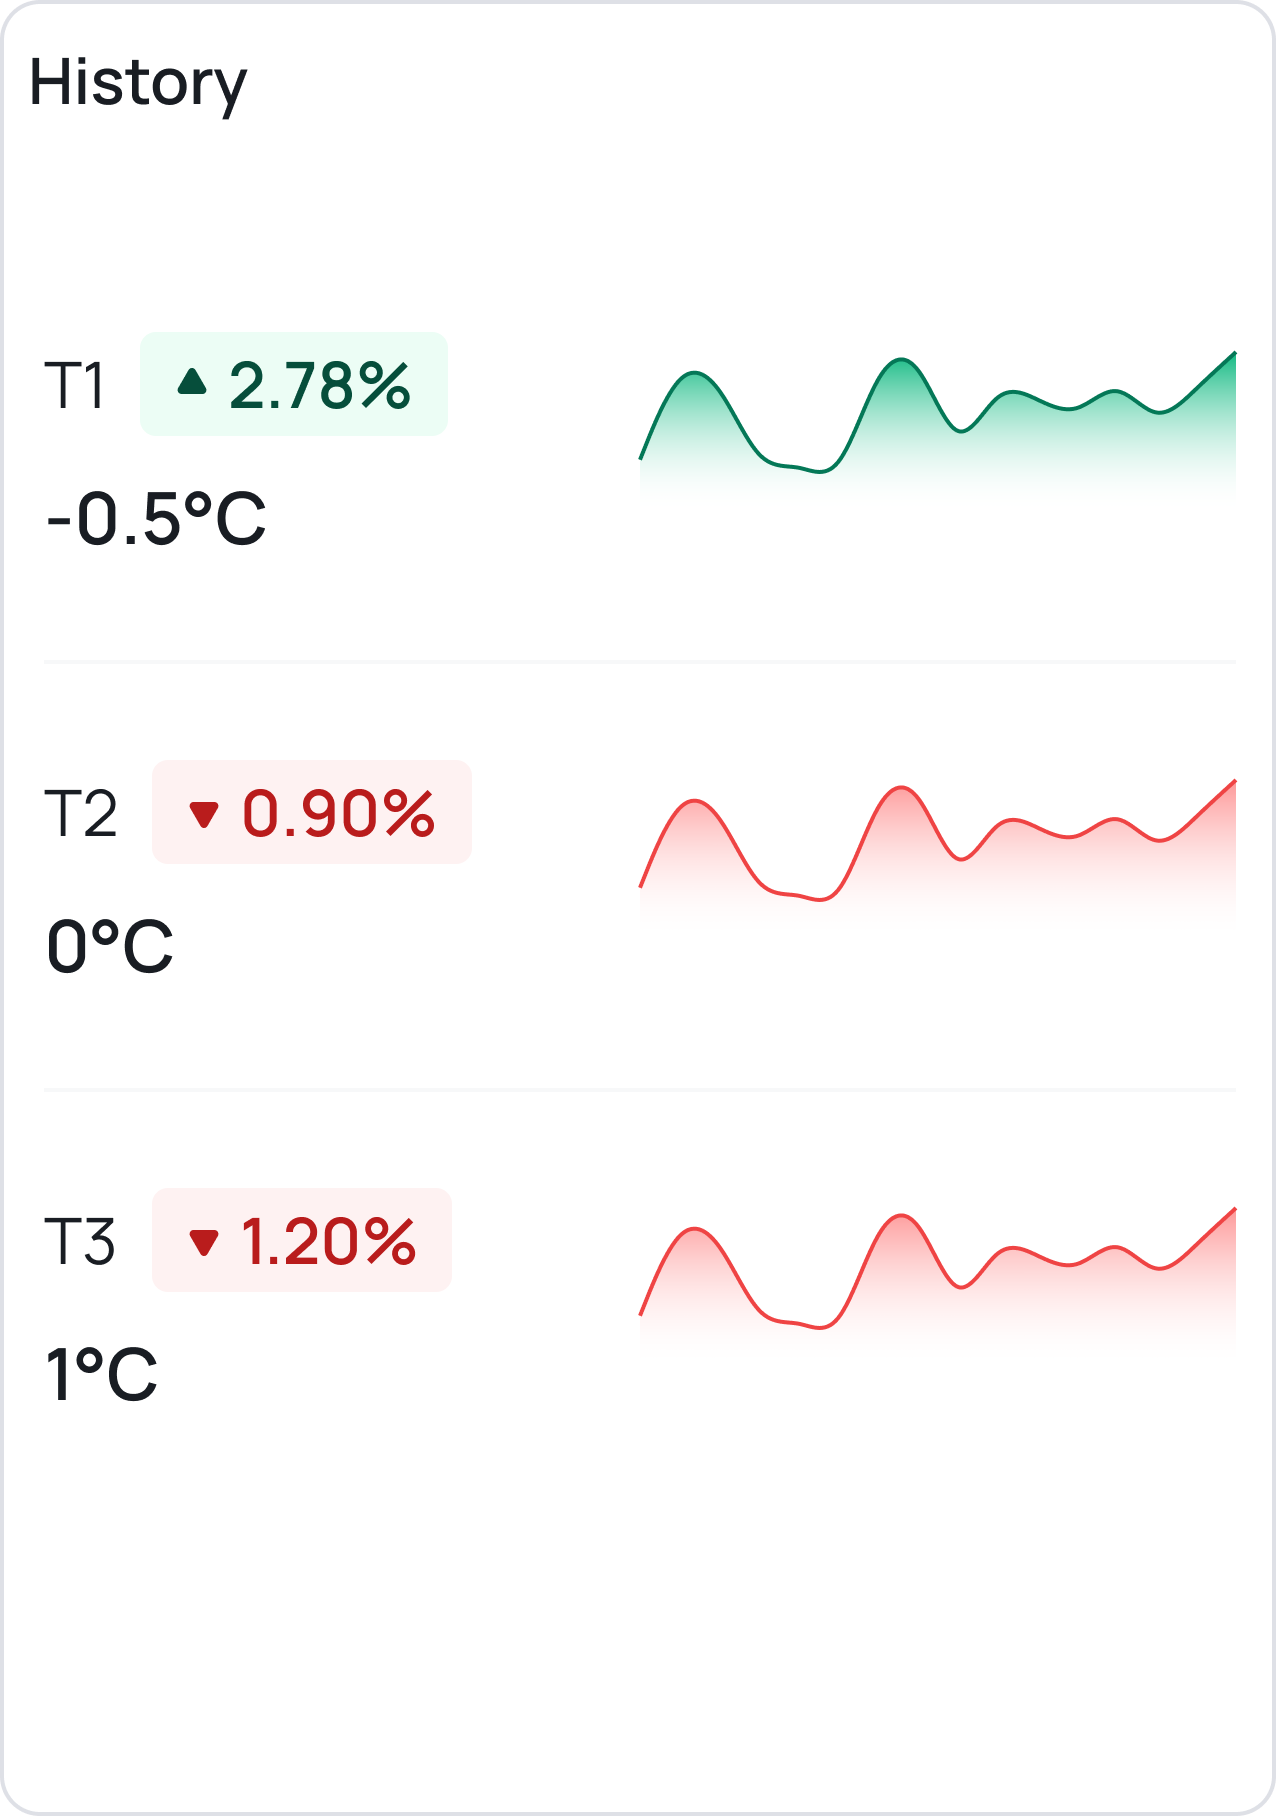
Tile Widget
Presents a value, with an optional icon or unit for additional context.
Use cases:
- Display temperature with °C unit
- Display humidity with % unit
- Show device status with an icon
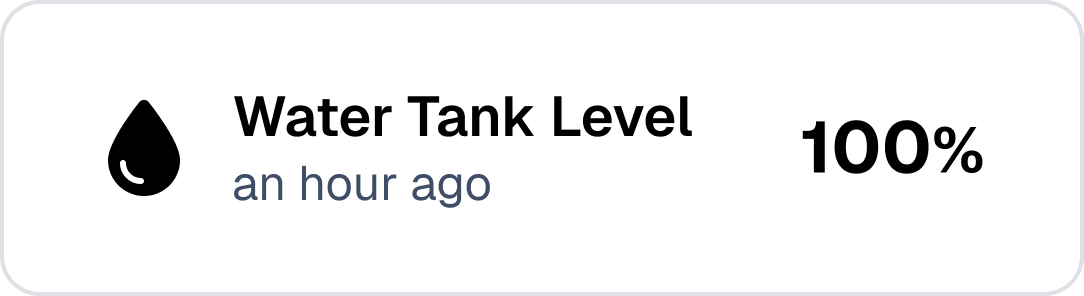
Card Widget
Shows a value in a horizontal layout.
Use cases:
- Display battery level of a device
- Diplay speed of a vehicle
- Show total number of data points received
Dial Widget
Represents the last value using a dial progress indicator.
Use cases:
- Display fuel level in a tank
- Display position of a valve
- Display speed of a motor

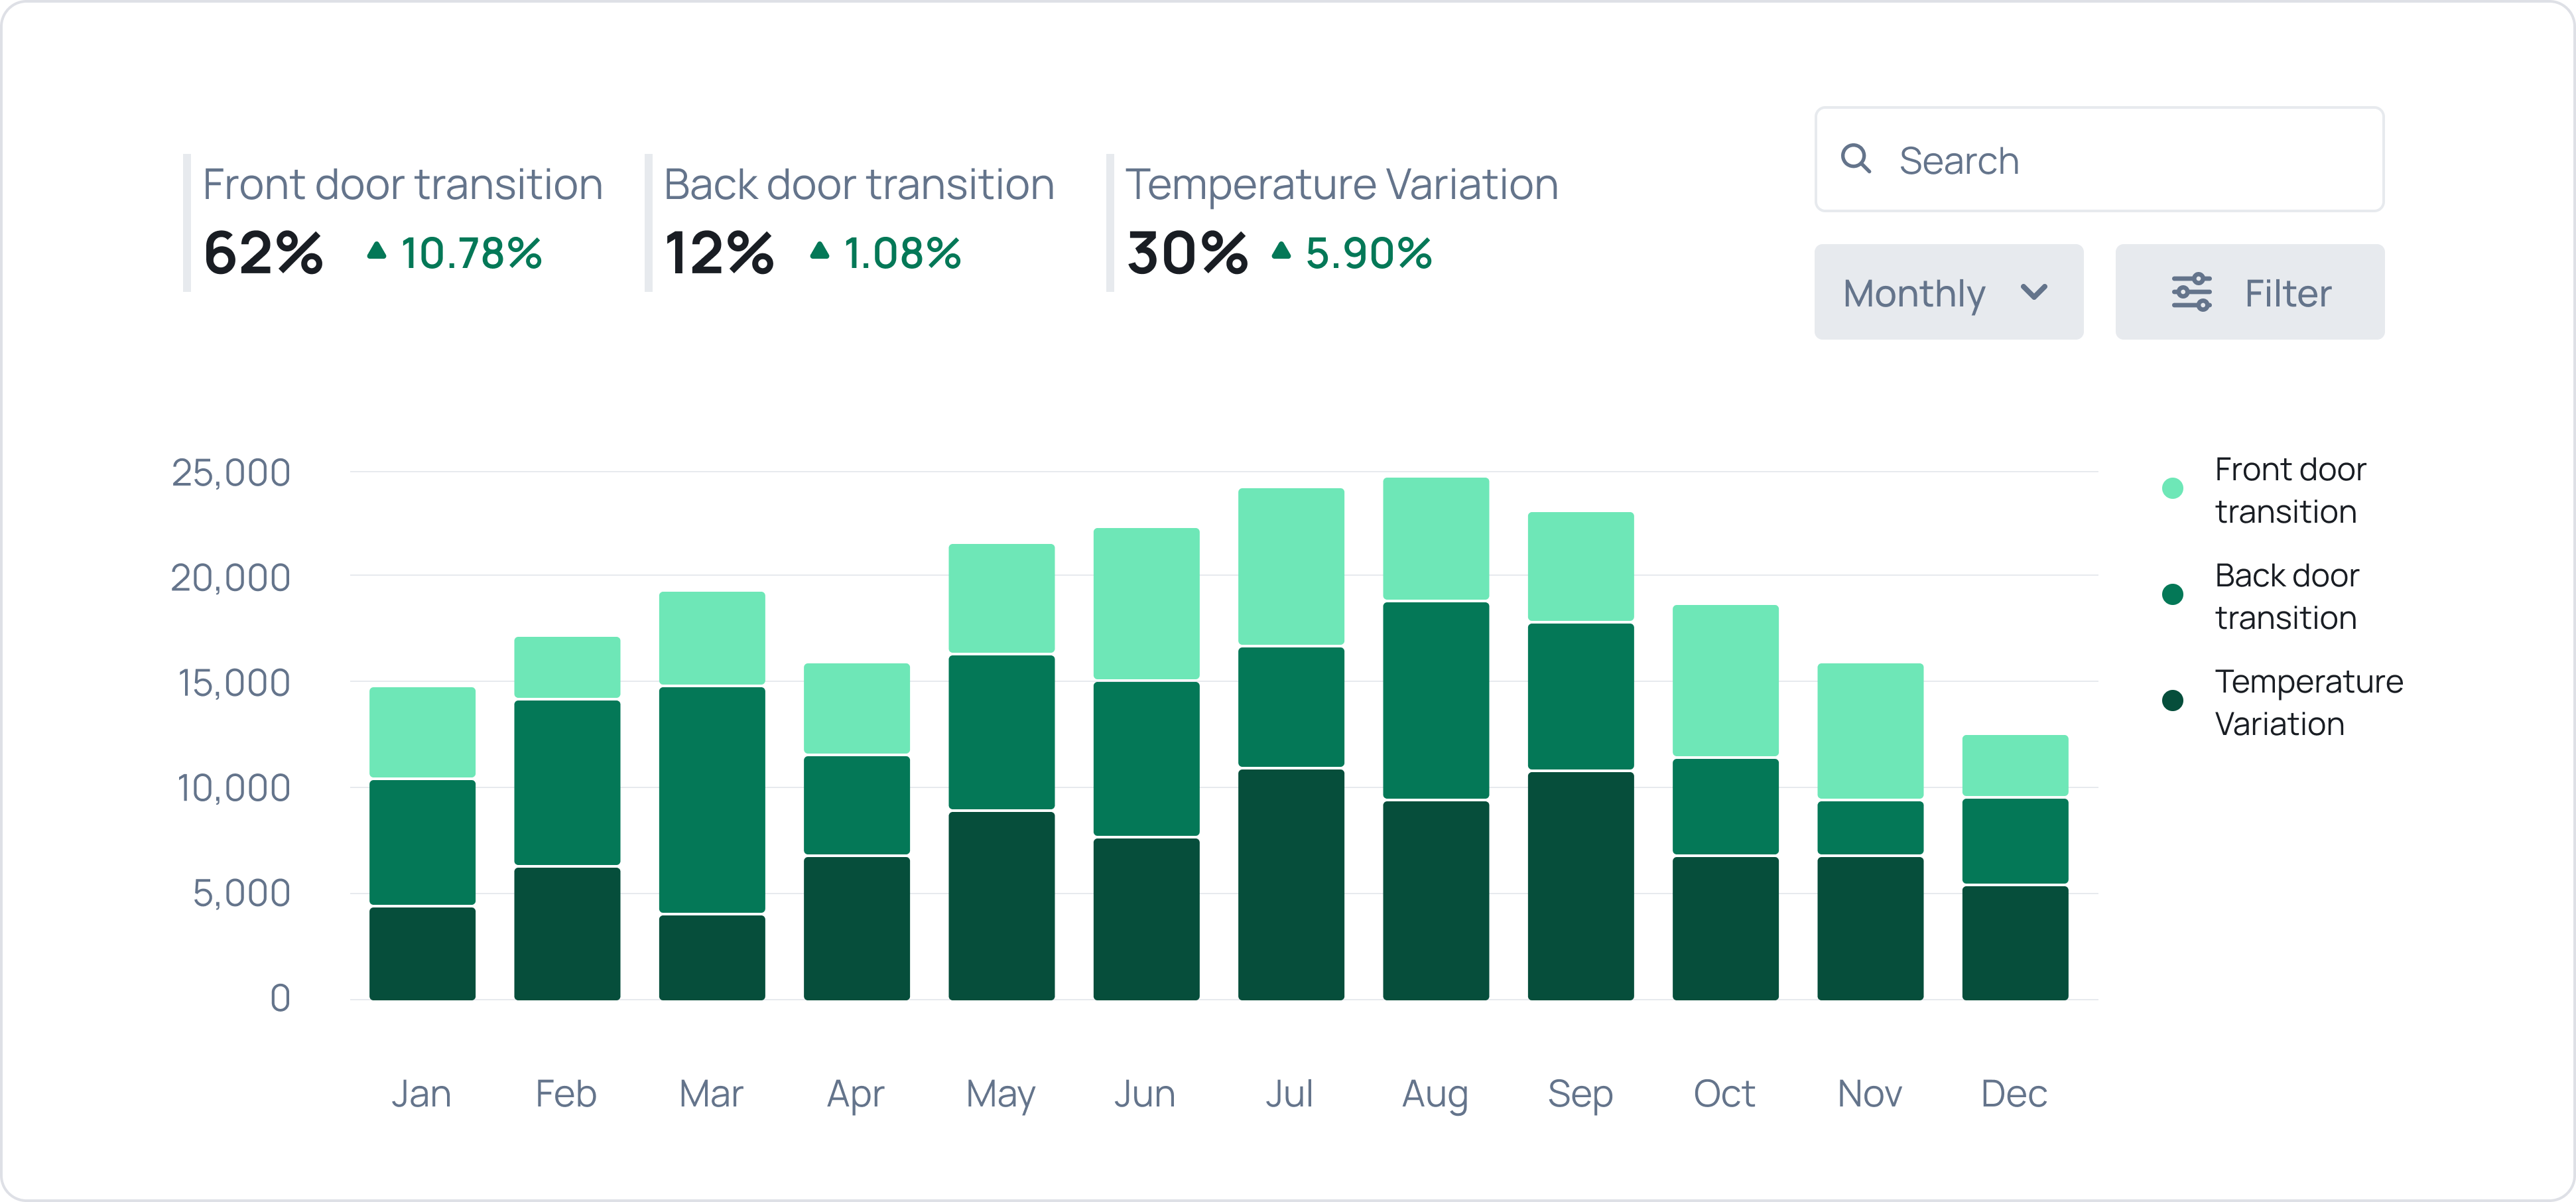
Time Series Widget
Visualizes time-series data using lines, bars, or other types.
Use cases:
- Show temperature over time
- Display humidity trends
- Display energy consumption patterns
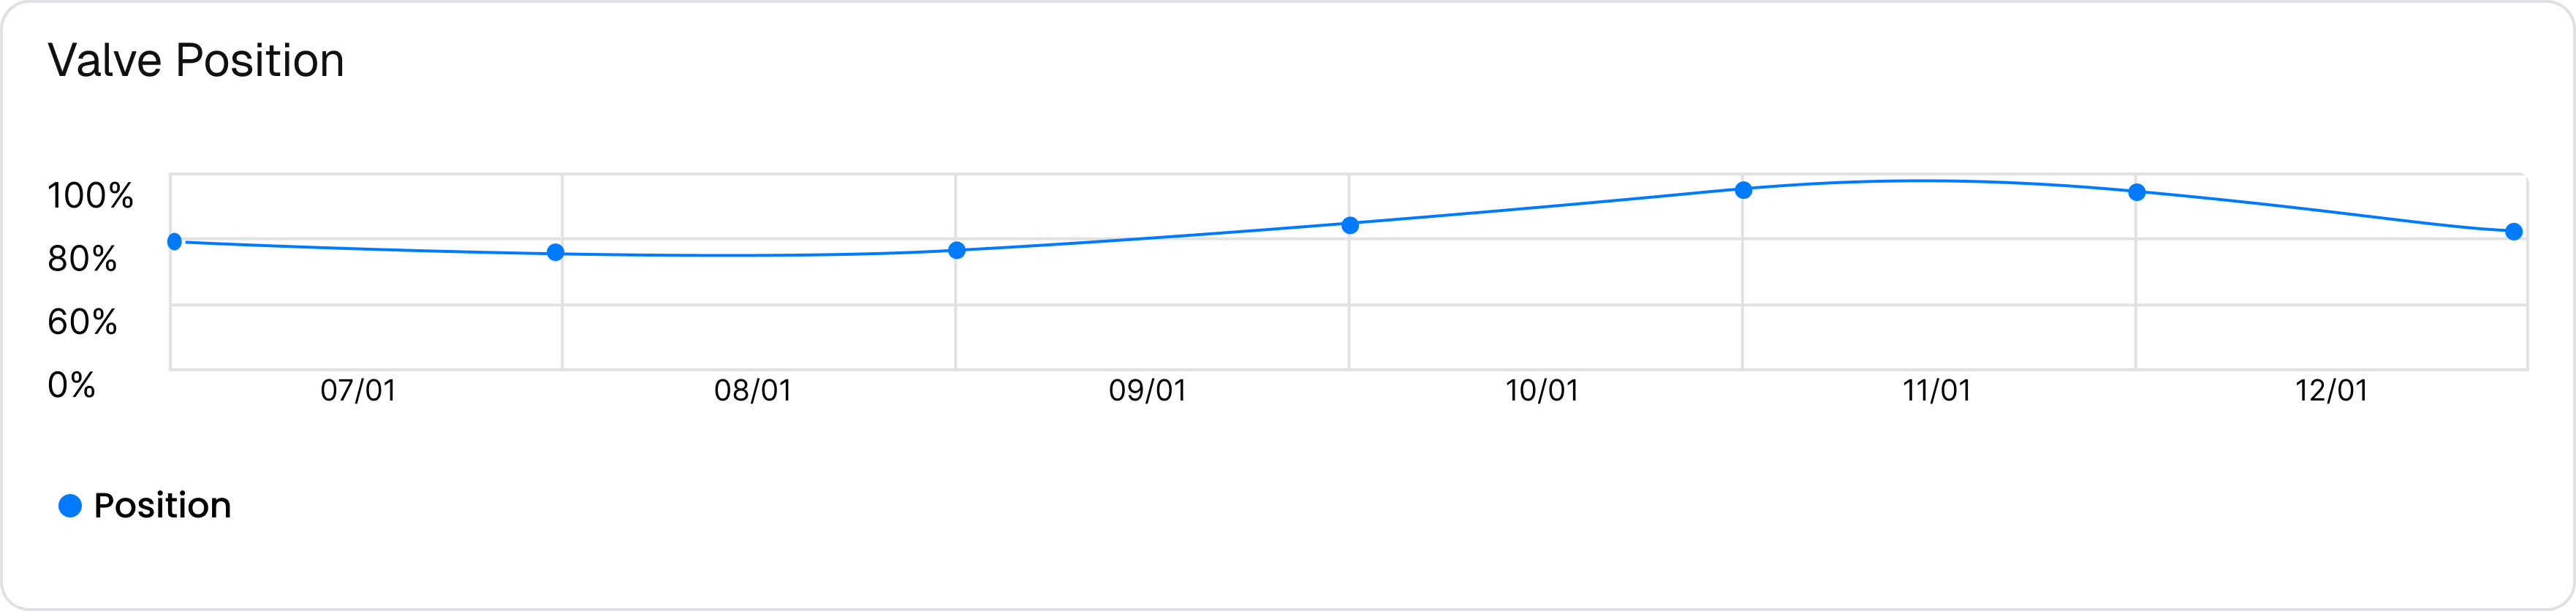
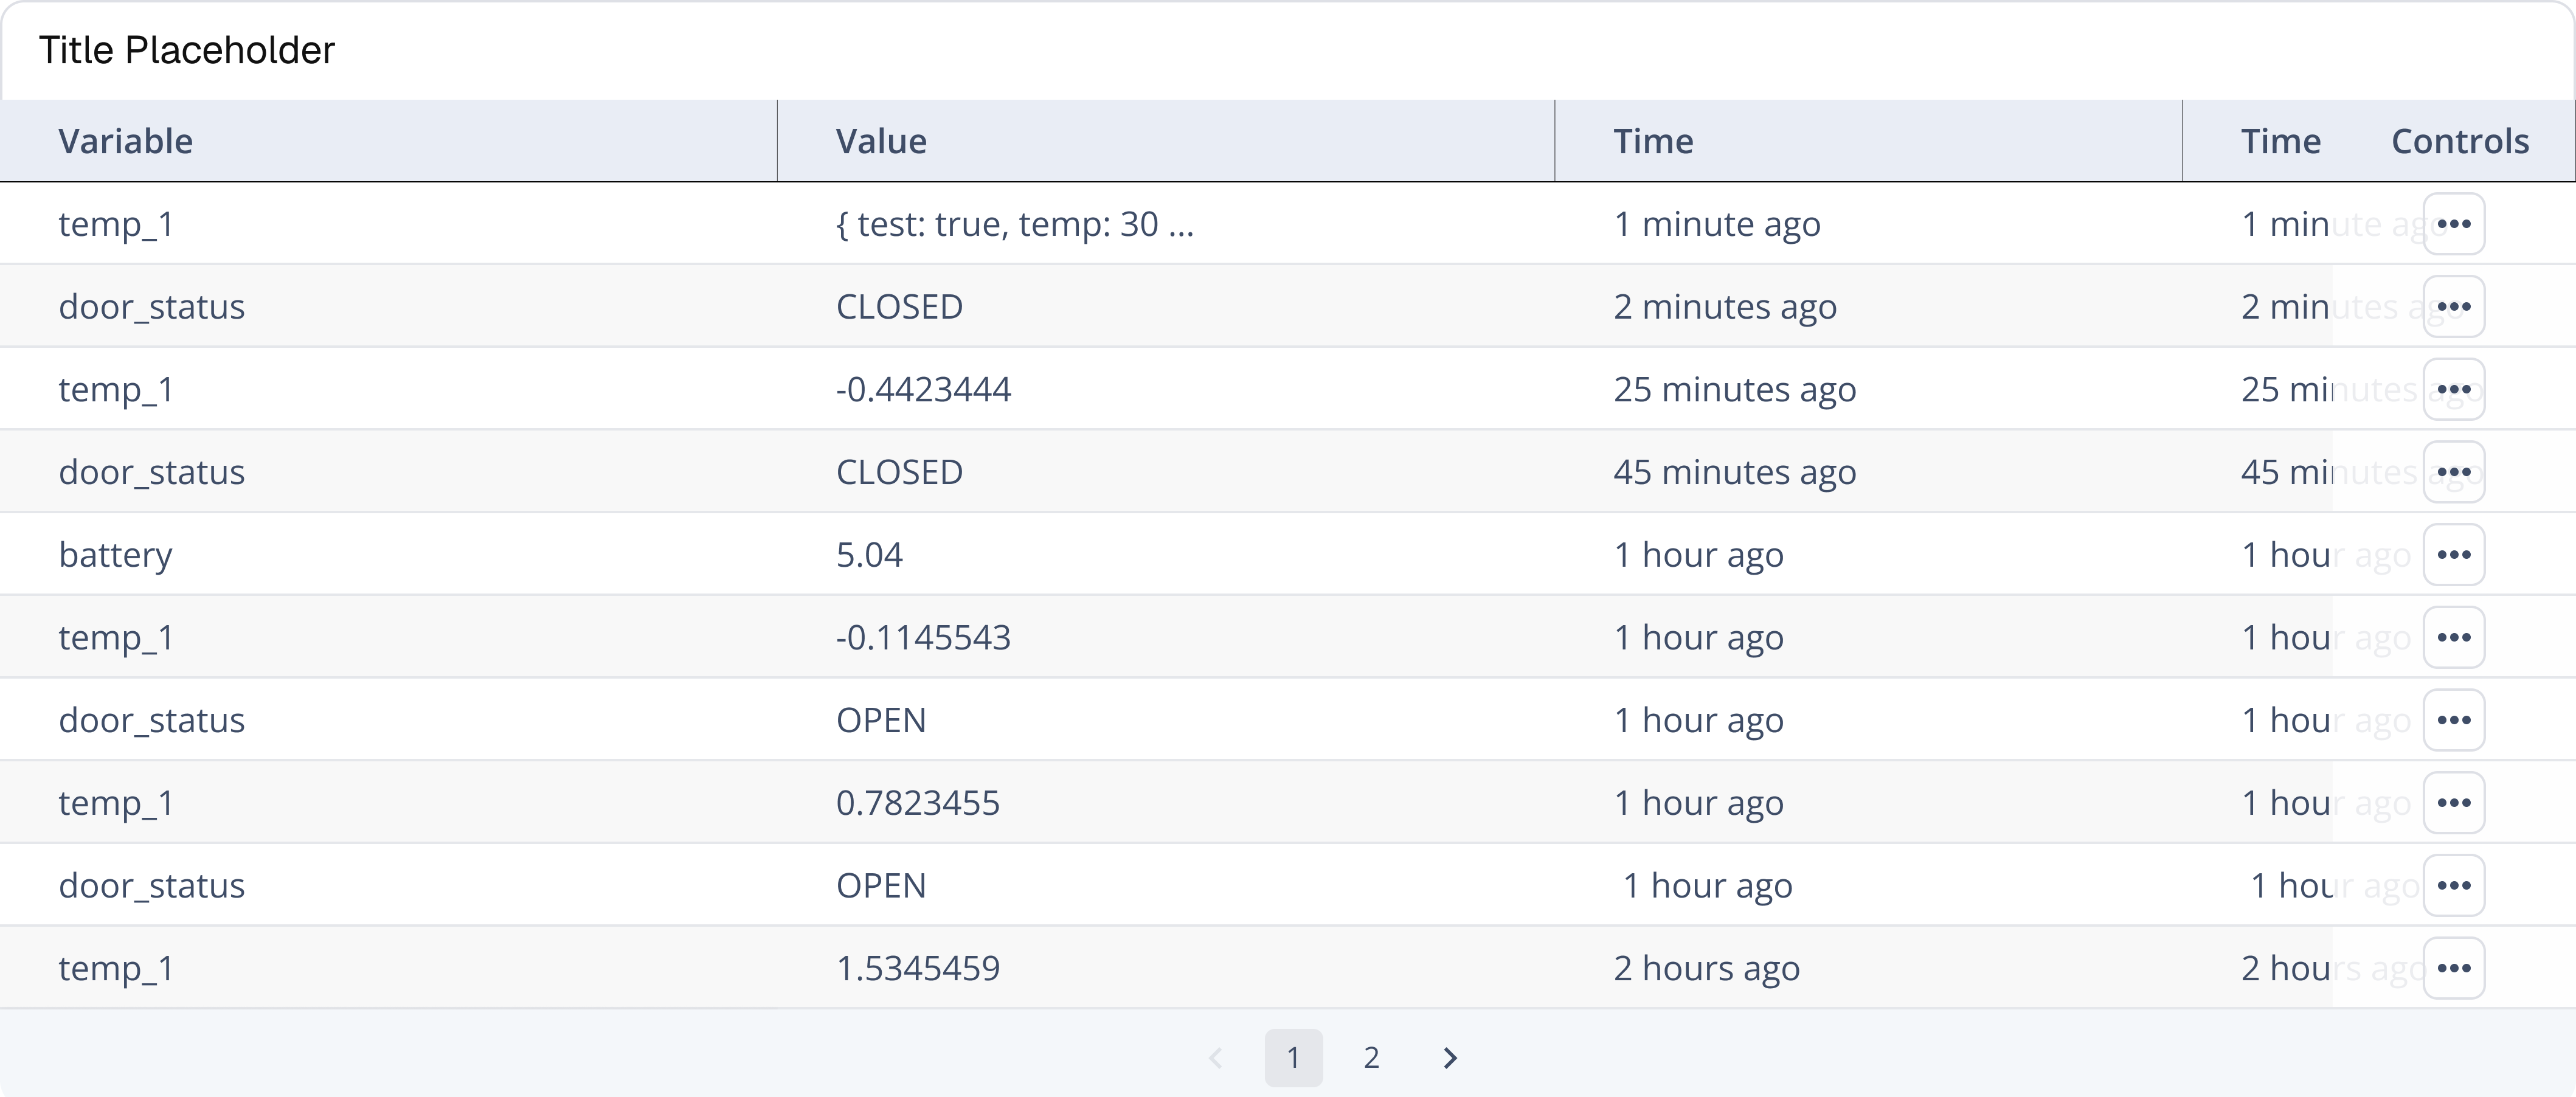
Table Widget
Presents information in a tabular format.
Use cases:
- List devices with their statuses
- List sensor readings
- Show inventory of assets
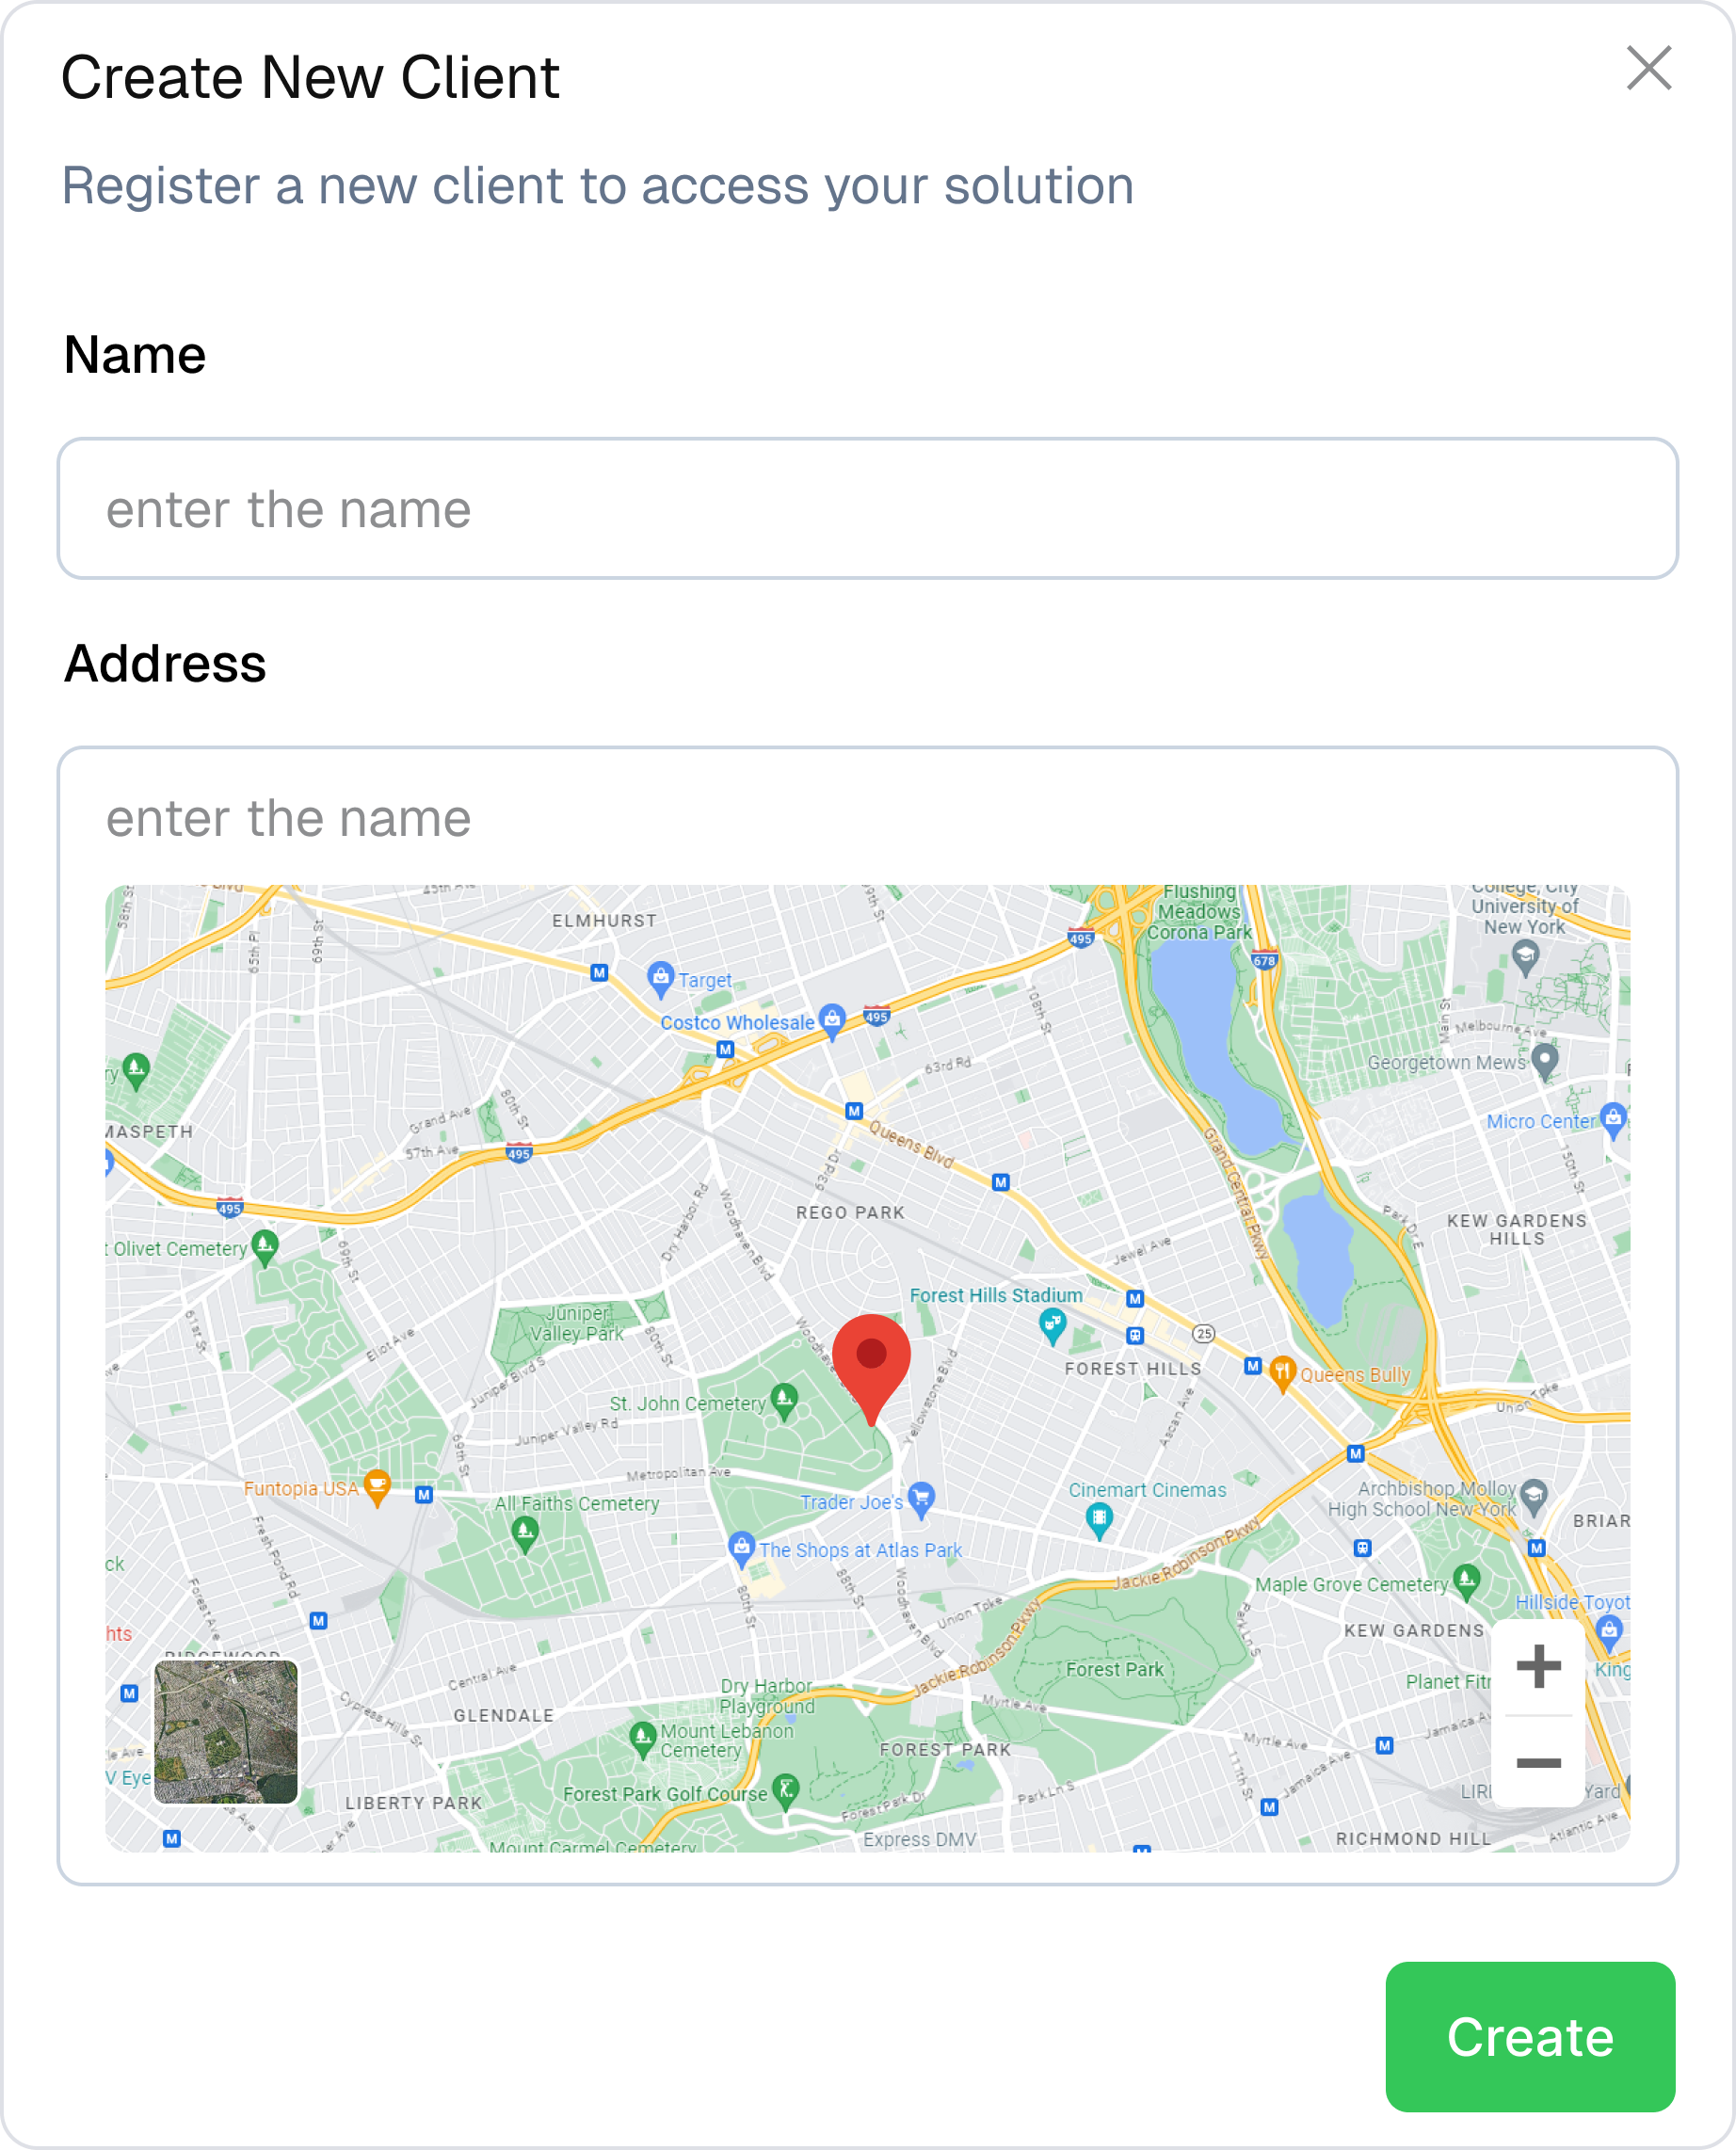
Forms Widget
Enables data input.
Use cases:
- Send commands to devices
- Update object properties
- Trigger scripts
Custom Widget
The custom widget let you insert any front-end code to create personalized views.
Use cases:
- Create a map with logic of your own
- Build a specialized chart
- Create a full custom layout
More to come
We’re continually developing widgets, new additions are coming soon.
Next Steps:
Learn Widget Configuration in detail.